There is a lot on the Internet contrasting data, information and knowledge, with some comparisons even throwing in wisdom. That is not the intent of this post. For the purposes of this post, I will use grossly simplified meanings purely to support the point of what I am sharing.
It is commonly said that DATA is just raw values (numbers, words, characters, etc.), that has not been assimilated in a useful manner; whereas INFORMATION is data that has been assimilated and reported in a way that adds value along with context. Too many companies simply use GoldMine to capture data, but never take that next step of assimilating it or analyzing it in a way that adds true value.
The real value of information management tools, such as GoldMine, is best realized with solid reporting tools and analytics. So much value can be gained by analyzing and reporting on the data gathered within GoldMine (and other sources).
The three areas I see deliver the most value to clients that strive for true information management are:
- SQL queries – for quick analysis and quantifying whatever they desire to measure.
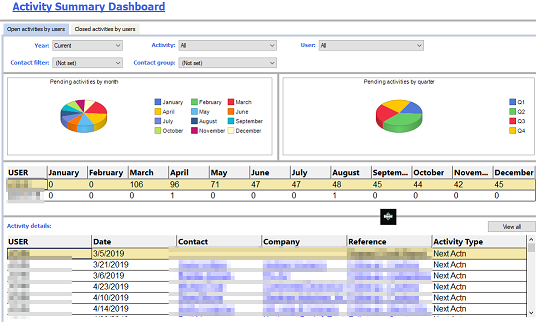
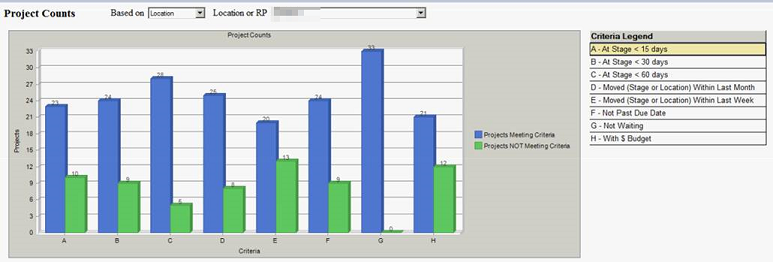
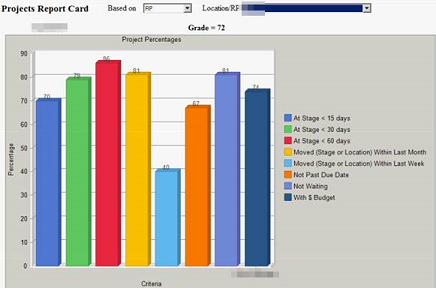
- Dashboards – for better graphical or visual support, including the ability to drill-down and see the details behind what is initially summarized.
- Reports delivered to the email Inbox – for anyone that simply wants specific reports delivered to their email Inbox, we can automatically generate Crystal Reports and email the results as PDF attachments.
Between GoldMine’s own Dashboards feature AND GoldMine’s integration with Crystal Reports (one of the most powerful reporting tools available), there is very little that we cannot do along the lines of measuring and reporting within GoldMine. As long as the data is being entered consistently and properly, we can most assuredly analyze and report on it. And if the data is NOT being entered consistently and properly, these same tools can be used to identify such data issues so they can be corrected. In many cases, we actually configure real-time dynamic pop-ups that raise awareness of a data issue at the time of data entry.
Dashboards can present dynamic graphical results along with listings and real-time links to the data itself. While viewing results within a GoldMine Dashboard, you can drill-down within the results and actually pull up the specific data being reported on. Very powerful!
Here are screen snippets of a few examples:
Crystal Reports can be configured to report on your data in an extremely broad range of ways.
Further, we can configure these Crystal Reports to be run automatically AND to subsequently send the results to anyone via email. Very powerful!
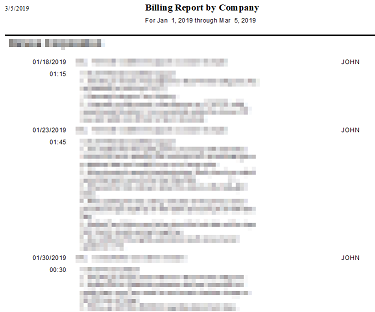
Example email with Crystal Reports results attached as a PDF document:
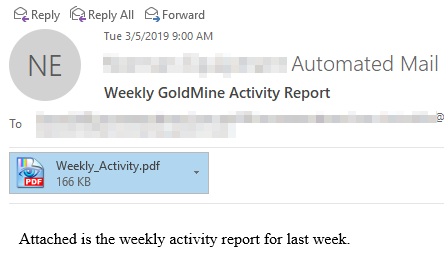
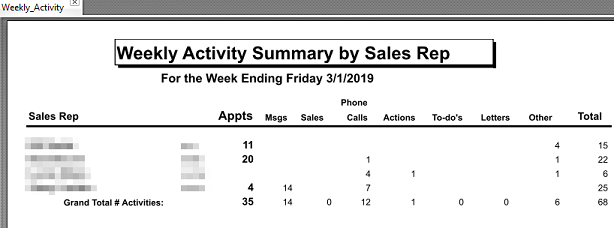
Opening the attached PDF document reveals the results of the Crystal Report:
Depending on the source of the data, we can also configure Dashboards and/or Crystal Reports to report on data that exist OUTSIDE of GoldMine. Yes, we can use these same tools, even if the data resides in some other system. Again, very powerful!
For Him Consulting has a lot of experience with setting up this type of reporting and automation. If you feel that your organization could benefit from such, please let us know. We would be happy to help you gain more value out of the tools you already have and use.
We are here to serve you!
0 Comments